


In 2025, global new shipbuilding orders saw an overall decline, but the order data in December showed a month-on-month and year-on-year increase, the first time this has happened in 2025. Chinese shipyards continued to dominate the market with 223 newbuildings.
According to Clarksons data released on January 7, 2026, global new ship orders in December 2025 totaled 8.09 million compensated gross tonnages (CGT, 264 vessels). Measured in CGT, this represents a 69% increase compared to the same period last year (4.79 million CGT) and a 23% rise month-on-month (6.59 million CGT).
By country, Chinese shipyards received new orders totaling 5.71 million CGT (223 vessels), securing a 71% market share and maintaining their leading position. South Korean shipyards received new orders totaling 1.47 million CGT (23 vessels), with a market share of 18%, ranking second. Compared to the data from November 2025, China’s market share increased from 50% to 71%, while South Korea’s market share dropped from 38% to 18%. The market share difference between Chinese and South Korean shipyards surged from 12% to 53%, reflecting the strong market competitiveness of Chinese shipbuilders.
Data shows that from January to December 2025, the total number of global new shipbuilding orders was 56.43 million CGT (2,036 vessels), a decrease of approximately 27% compared to the same period last year (76.78 million CGT, 3,235 vessels). During this period, Chinese shipyards received orders totaling 35.37 million CGT (1,421 vessels), accounting for a 63% market share. This represents a 35% decrease in order volume compared to the previous year (54.24 million CGT, 2,261 vessels), placing China first. South Korean shipyards received orders totaling 11.60 million CGT (247 vessels), accounting for a 21% market share, an increase of approximately 8% compared to the previous year (10.78 million CGT, 254 vessels), ranking them second.
Global shipbuilding order backlogs are showing an upward trend. As of the end of December 2025, the global backlog of newbuilding orders totaled 173.91 million CGT, an increase of 3.12 million CGT compared to the previous month. By country, Chinese shipyards held 107.48 million CGT in orders, an increase of 10.01 million CGT compared to the same period last year and a month-on-month increase of 1.91 million CGT, maintaining their leading market share of 62%. South Korean shipyards held 35.12 million CGT in orders, a decrease of 2.45 million CGT compared to the same period last year but a month-on-month increase of 1.21 million CGT, securing the second position with a market share of 20%.
Throughout 2025, based on monthly data, Chinese shipbuilders topped the rankings for 10 months: February, April, May, June, July, August, September, October, November, and December, securing the monthly championship for nine consecutive months. South Korean shipbuilders led for two months: January and March. Notably, December 2025 marked the first instance of year-on-year growth for the entire year, as well as the first month to demonstrate both year-on-year and month-on-month growth.
As of the end of December 2025, the Clarkson Newbuilding Price Index stood at 184.65, marking a slight increase of 0.32 points from the previous month (184.33) and maintaining overall stability. Compared to the level recorded in December 2020, the index has risen by 47%, indicating a sustained upward trend in ship prices.
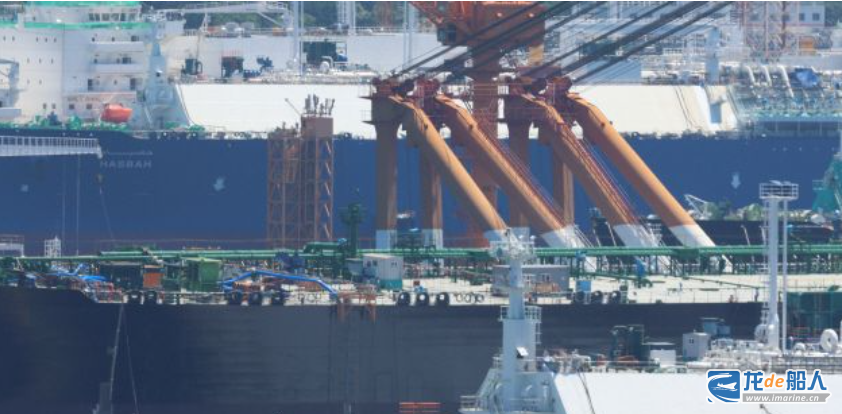
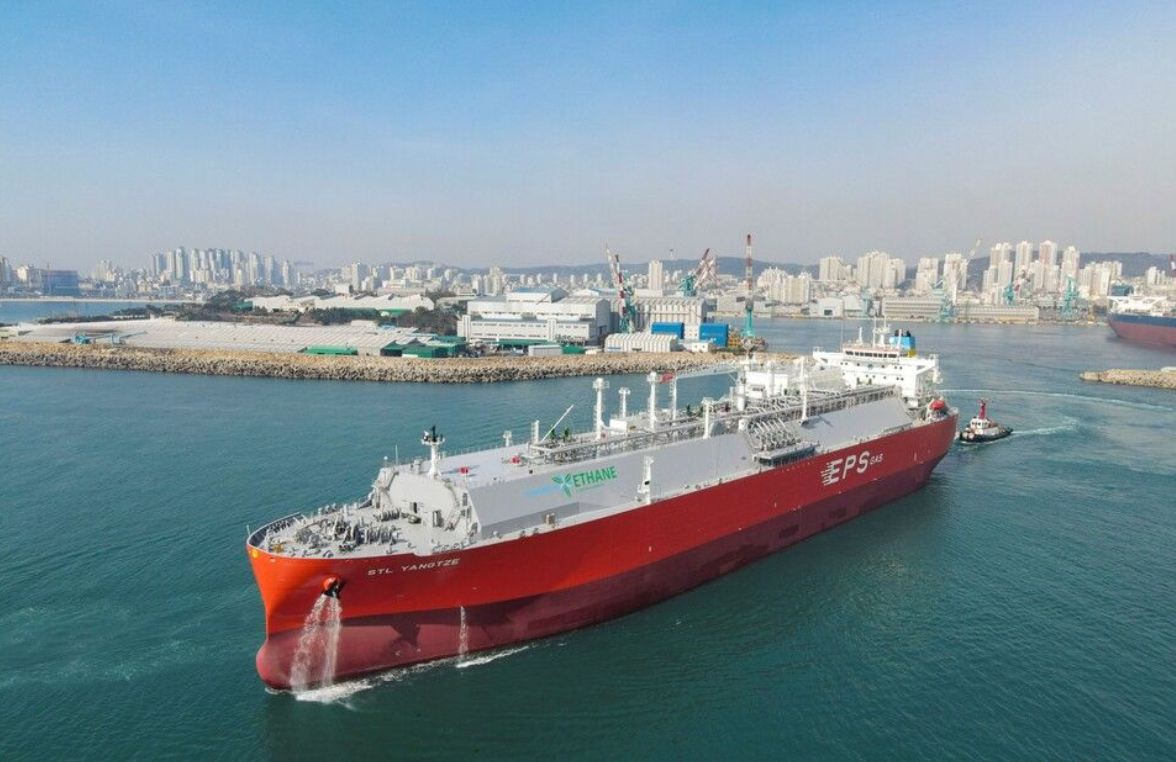
By vessel type, the newbuilding price for a 174,000 m³ liquefied natural gas (LNG) carrier is approximately $248 million; for a very large crude carrier (VLCC), it is approximately $128 million; and for a very large container ship (22,000 TEU–24,000 TEU), it is approximately $262 million.
2025 Annual Data Review:
- In January, global new ship orders totaled 1.46 million CGT (51 vessels), marking a 74% year-on-year decline.
- In February, global new ship orders totaled 2.07 million CGT (50 vessels), marking a 56% year-on-year decline from 5.41 million CGT and a 16% month-on-month increase from 1.78 million CGT.
- In March, global new ship orders totaled 1.5 million CGT (58 vessels), down 4% year-on-year (2.597 million CGT) and down 27% month-on-month (2.07 million CGT).
- In April, global new ship orders totaled 3.64 million CGT (75 vessels), marking a 56% year-on-year decline from 8.36 million CGT and an 82% month-on-month increase from 2.00 million CGT.
- In May, global new ship orders totaled 1.66 million CGT (71 vessels), marking a 55% year-on-year decline from 3.66 million CGT and a 64% month-on-month decrease from 4.60 million CGT.
- In June, global new ship orders totaled 2.56 million CGT (84 vessels), marking an 81% year-on-year decline from 13.26 million CGT and a 44% month-on-month increase from 1.78 million CGT.
- In July, global new ship orders totaled 2.03 million CGT (58 vessels), marking a 58% year-on-year decline from 4.87 million CGT and a 43% month-on-month decrease from 3.54 million CGT.
- In August, global new ship orders totaled 2.44 million CGT (82 vessels), marking a 65% year-on-year decline from 6.93 million CGT and an 18% decrease from the previous month.
- In September, global new ship orders totaled 3.5 million CGT (123 vessels), marking a sharp 44% year-on-year decline from 6.29 million CGT and a 3% month-on-month decrease.
- In October, global new ship orders totaled 2.91 million CGT (118 vessels), marking a 38% year-on-year decline from 4.71 million CGT and a 33% month-on-month decrease from 4.37 million CGT.
- In November, global new ship orders totaled 5.13 million CGT (152 vessels), marking a slight 1% year-on-year decrease from 5.17 million CGT and a 72% month-on-month increase from 2.99 million CGT.
- In December, global new ship orders totaled 8.09 million CGT (264 vessels), marking a 69% increase year-on-year (4.79 million CGT) and a 23% rise month-on-month (6.59 million CGT).